
Legacy Custom Widgets
This documentation is intended as a reference for developing around Geckoboard's legacy custom widgets, i.e. how to format and send your custom data to your Geckoboard dashboards. It details the supported visualizations and parameters and options that you can tweak to get the most out of your data.
If you get stuck, have trouble, or need a hand, then check out our step by step guide on our Help Center.
Custom Widget Types
There are a number of different custom widget types that you can use to display your data. Each type provides a different visualization and requires a different data format.
Bar Chart
{
  "x_axis": {
    "labels": [
      "2000",
      "2001",
      "2002",
      "2003",
      "2004",
      "2005"
    ]
  },
  "y_axis": {
    "format": "currency",
    "unit": "USD"
  },
  "series": [
    {
      "data": [
        1000,
        1500,
        30600,
        28800,
        22300,
        36900
      ]
    }
  ]
}
<?xml version="1.0" encoding="UTF-8"?>
<root>
  <x_axis>
    <labels>2000</labels>
    <labels>2001</labels>
    <labels>2002</labels>
    <labels>2003</labels>
    <labels>2004</labels>
    <labels>2005</labels>
  </x_axis>
  <y_axis>
    <format>currency</format>
    <unit>USD</unit>
  </y_axis>
  <series>
    <data>1000</data>
    <data>1500</data>
    <data>30600</data>
    <data>28800</data>
    <data>22300</data>
    <data>36900</data>
  </series>
</root>
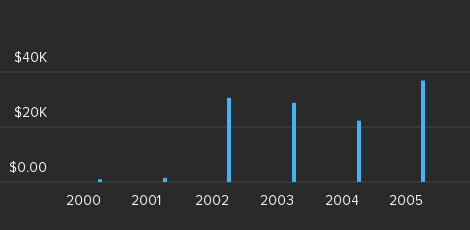
The bar chart visualization is best suited to discrete, categorical data. Example uses include seeing a breakdown of the number of support tickets by current status, or the sales of your product line by year.
Supported sizes
This widget supports all available sizes.
Parameters
series
An array containing up to three data series objects.
data- An array of data points for the bar chart. Each data point may be given as a single number, such as
[3, 5, 8].
x_axis
Optional configuration options for the X axis.
labelsoptional- An array of strings specifying the labels for each of the data points in the series.
typeoptional- Specifying the string
"datetime"will cause all X-axis labels to be interpreted as an ISO 8601 date/time. Partial dates (e.g.2014-10for October 2014) are supported. Leavingtypeempty or setting it tostandardwill cause X values to be interpreted the usual way.
y_axis
Optional configuration options for the Y axis.
formatoptional- If given, this string will represent the format of the Y axis and will be displayed accordingly. Possible values are
"decimal","percent"and"currency". The default is"decimal". unitoptional- When the format is
currencythis must be an ISO 4217 currency code. E.g."GBP","USD","EUR".
Simple Example
{
  "x_axis": {
    "labels": ["open", "pending", "solved", "closed"]
  },
  "series": [
    {
      "data": [45, 4, 251, 554]
    }
  ]
}
<?xml version="1.0" encoding="UTF-8" ?>
<root>
  <x_axis>
    <labels>open</labels>
    <labels>pending</labels>
    <labels>solved</labels>
    <labels>closed</labels>
  </x_axis>
  <series>
    <data>45</data>
    <data>4</data>
    <data>251</data>
    <data>554</data>
  </series>
</root>
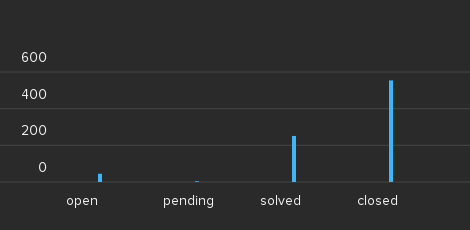
This example demonstrates the usage of a "simple" bar chart with the distribution of support tickets by status.
Datetime example
{
  "x_axis": {
    "type": "datetime",
    "labels": [
      "2014-01",
      "2014-02",
      "2014-03",
      "2014-04",
      "2014-05",
      "2014-06"
    ]
  },
  "series": [
    {
      "data": [
        71173,
        57624,
        64851,
        60486,
        60500,
        62908
      ]
    }
  ]
}
<?xml version="1.0" encoding="UTF-8" ?>
<root>
  <x_axis>
    <type>datetime</type>
    <labels>2014-01</labels>
    <labels>2014-02</labels>
    <labels>2014-03</labels>
    <labels>2014-04</labels>
    <labels>2014-05</labels>
    <labels>2014-06</labels>
  </x_axis>
  <series>
    <data>71173</data>
    <data>57624</data>
    <data>64851</data>
    <data>60486</data>
    <data>60500</data>
    <data>62908</data>
  </series>
</root>
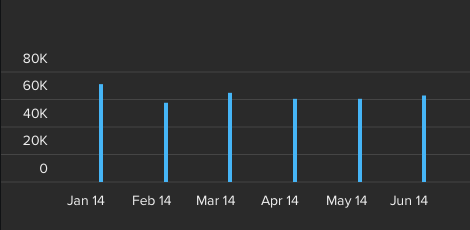
Settings the X axis type option to "datetime" causes the array of
strings provided as labels to be interpreted as ISO 8601
date/time specifiers. Please note that partial dates, such as "2014",
"2014-01", etc. are supported and may be provided.
Multiseries example
{
  "x_axis": {
    "labels": [
      "2000",
      "2001",
      "2002",
      "2003",
      "2004",
      "2005"
    ]
  },
  "y_axis": {
    "format": "currency",
    "unit": "USD"
  },
  "series": [
    {
      "name": "Apples",
      "data": [
        1000,
        1500,
        30600,
        28800,
        22300,
        36900
      ]
    },
    {
      "name": "Bananas",
      "data": [
        2000,
        3000,
        40600,
        58800,
        42300,
        76900
      ]
    },
    {
      "name": "Pears",
      "data": [
        4000,
        5500,
        70600,
        88800,
        62300,
        86900
      ]
    }
  ]
}
<?xml version="1.0" encoding="UTF-8" ?>
    <root>
    <x_axis>
        <labels>2000</labels>
        <labels>2001</labels>
        <labels>2002</labels>
        <labels>2003</labels>
        <labels>2004</labels>
        <labels>2005</labels>
    </x_axis>
    <y_axis>
        <format>currency</format>
        <unit>USD</unit>
    </y_axis>
    <series>
        <name>Apples</name>
        <data>1000</data>
        <data>1500</data>
        <data>30600</data>
        <data>28800</data>
        <data>22300</data>
        <data>36900</data>
    </series>
    <series>
        <name>Bananas</name>
        <data>2000</data>
        <data>3000</data>
        <data>40600</data>
        <data>58800</data>
        <data>42300</data>
        <data>76900</data>
    </series>
    <series>
        <name>Pears</name>
        <data>4000</data>
        <data>5500</data>
        <data>70600</data>
        <data>88800</data>
        <data>62300</data>
        <data>86900</data>
    </series>
</root>
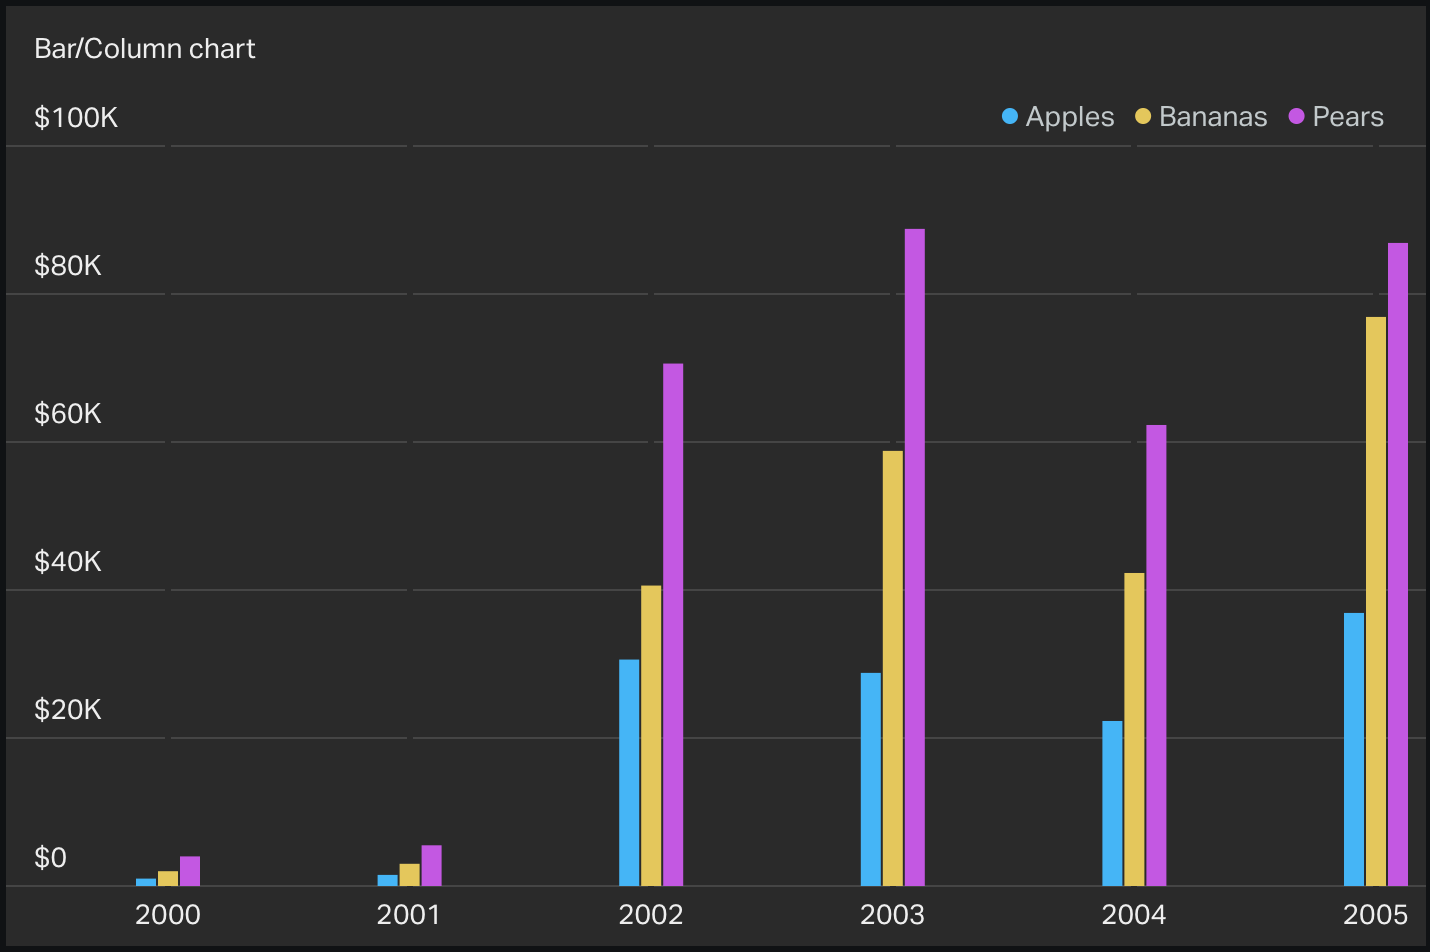
You can add additional elements to the series array in order to produce a multiseries bar chart.
Bullet Graph
{
  "orientation": "horizontal",
  "item": {
    "label": "Revenue 2014 YTD",
    "sublabel": "(U.S. $ in thousands)",
    "axis": {
      "point": ["0", "200", "400", "600", "800", "1000"]
    },
    "range": {
      "red": {
        "start": 0,
        "end": 400
      },
      "amber": {
        "start": 401,
        "end": 700
      },
      "green": {
        "start": 701,
        "end": 1000
      }
    },
    "measure": {
      "current": {
        "start": "0",
        "end": "500"
      },
      "projected": {
        "start": "100",
        "end": "900"
      }
    },
    "comparative": {
      "point": "600"
    }
  }
}
<?xml version="1.0" encoding="UTF-8"?>
<root>
  <orientation>horizontal</orientation>
  <item>
    <label>Revenue 2014 YTD</label>
    <sublabel>(U.S. $ in thousands)</sublabel>
    <axis>
      <point>0</point>
      <point>200</point>
      <point>400</point>
      <point>600</point>
      <point>800</point>
      <point>1000</point>
    </axis>
    <range>
      <red>
        <start>0</start>
        <end>400</end>
      </red>
      <amber>
        <start>401</start>
        <end>700</end>
      </amber>
      <green>
        <start>701</start>
        <end>1000</end>
      </green>
    </range>
    <measure>
      <current>
        <start>0</start>
        <end>500</end>
      </current>
      <projected>
        <start>100</start>
        <end>900</end>
      </projected>
    </measure>
    <comparative>
      <point>600</point>
    </comparative>
  </item>
</root>
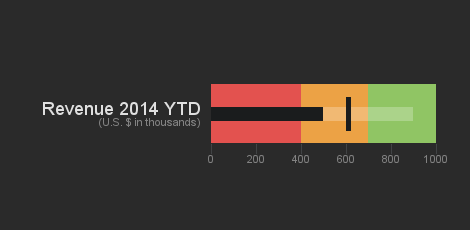
A bullet graph is an extremely efficient and flexible way to communicate a lot of information in a way that's easy to interpret and digest.
It is very useful when you want to track progress towards a goal. A good example of a metric for this visualization would be a sales or revenue target.
Supported sizes
- 2 x 1
- 1 x 2
- 2 x 2
Parameters
range
A bullet graph is divided into three contiguous ranges, each of which is identifiable by a different background colour:
- Red: the result is far below expectations
- Amber: the result is neither good nor bad
- Green: results in this range have met or exceeded expectations
The range array contains three objects, each of which represents the
size and extent of each of the portions of the bullet graph. Each of the
range objects must contain the following parameters.
color- This parameter identifies the range by its colour. The only allowed values are
red,amber, andgreen.
start- This numeric parameter indicates the amount at which this range starts.
-
end - This numeric parameter indicates the amount at which this range ends.
measure
The measure object allows you to specify two ranges to help
contextualise your data. Each of them uses the same start/end format
as the range objects above.
current- This range represents the current value and will be filled with the black line.
-
projected - This range will be filled with a white translucent line and represents the value you expect to achieve , given past performance. For example, if revenue so far is $1,000 and it's the 15th day of the month, you could set the
endof this range to2000.
comparative
The optional comparative object allows you to specify one or more values that
you wish to compare with the current value. For example, last year's
revenue, or a goal that you would like to share with your team.
point- This parameter may be set to either a number, in the case of a single comparative point, or an array of numbers, for multiple comparative points.
orientation
The optional orientation parameter allows you to specify the orientation of the bullet:
either horizontal or vertical. Certain widget sizes only work for certain orientations.
- 2 x 1: horizontal only
- 1 x 2: vertical only
- 2 x 2: both orientations are valid (default: horizontal)
Additional Parameters
axis- Specify the points on the axis by passing in a
pointarray of numbers.
label- The main label displayed next to the bullet graph.
sublabel- optional An optional sublabel. This is often used to indicate the units of the graph.
Multiple bullet graphs
{
  "orientation": "vertical",
  "item": [
    {
      "axis": {
        "point": [
          "0",
          "50",
          "100",
          "150",
          "200",
          "250"
        ]
      },
      "comparative": {
        "point": "220"
      },
      "label": "Revenue",
      "measure": {
        "current": {
          "end": "235",
          "start": "0"
        }
      },
      "range": {
        "red": {
          "end": "125",
          "start": "0"
        },
        "amber": {
          "end": "200",
          "start": "126"
        },
        "green": {
          "end": "250",
          "start": "201"
        }
      },
      "sublabel": "U.S. $ (1,000s)"
    },
    {
      "axis": {
        "point": [
          "0",
          "30",
          "60",
          "90",
          "120",
          "150"
        ]
      },
      "comparative": {
        "point": "80"
      },
      "label": "Expenses",
      "measure": {
        "current": {
          "end": "65",
          "start": "0"
        }
      },
      "range": {
        "red": {
          "end": "150",
          "start": "91"
        },
        "amber": {
          "end": "90",
          "start": "51"
        },
        "green": {
          "end": "50",
          "start": "0"
        }
      },
      "sublabel": "U.S. $ (1,000s)"
    },
    {
      "axis": {
        "point": [
          "0",
          "100",
          "200",
          "300",
          "400",
          "500"
        ]
      },
      "comparative": {
        "point": "450"
      },
      "label": "Avg Order",
      "measure": {
        "current": {
          "end": "230",
          "start": "0"
        }
      },
      "range": {
        "red": {
          "end": "250",
          "start": "0"
        },
        "amber": {
          "end": "400",
          "start": "251"
        },
        "green": {
          "end": "500",
          "start": "401"
        }
      },
      "sublabel": "U.S. $"
    },
    {
      "axis": {
        "point": [
          "0",
          "1",
          "2",
          "3",
          "4",
          "5"
        ]
      },
      "comparative": {
        "point": "4.3"
      },
      "label": "Cust Sat",
      "measure": {
        "current": {
          "end": "4.6",
          "start": "0"
        }
      },
      "range": {
        "red": {
          "end": "3.3",
          "start": "0"
        },
        "amber": {
          "end": "4.25",
          "start": "3.4"
        },
        "green": {
          "end": "5",
          "start": "4.26"
        }
      },
      "sublabel": "Top Rating of 5"
    }
  ]
}
<?xml version="1.0" encoding="UTF-8"?>
<root>
  <orientation>vertical</orientation>
  <item>
    <label>Revenue</label>
    <sublabel>U.S. $ (1,000s)</sublabel>
    <axis>
      <point>0</point>
      <point>50</point>
      <point>100</point>
      <point>150</point>
      <point>200</point>
      <point>250</point>
    </axis>
    <range>
      <red>
        <start>0</start>
        <end>125</end>
      </red>
      <amber>
        <start>126</start>
        <end>200</end>
      </amber>
      <green>
        <start>201</start>
        <end>250</end>
      </green>
    </range>
    <measure>
      <current>
        <start>0</start>
        <end>235</end>
      </current>
    </measure>
    <comparative>
      <point>220</point>
    </comparative>
  </item>
  <item>
    <label>Expenses</label>
    <sublabel>U.S. $ (1,000s)</sublabel>
    <axis>
      <point>0</point>
      <point>30</point>
      <point>60</point>
      <point>90</point>
      <point>120</point>
      <point>150</point>
    </axis>
    <range>
      <red>
        <start>91</start>
        <end>150</end>
      </red>
      <green>
        <start>0</start>
        <end>50</end>
      </green>
      <amber>
        <start>51</start>
        <end>90</end>
      </amber>
    </range>
    <measure>
      <current>
        <start>0</start>
        <end>65</end>
      </current>
    </measure>
    <comparative>
      <point>80</point>
    </comparative>
  </item>
  <item>
    <label>Avg Order</label>
    <sublabel>U.S. $</sublabel>
    <axis>
      <point>0</point>
      <point>100</point>
      <point>200</point>
      <point>300</point>
      <point>400</point>
      <point>500</point>
    </axis>
    <range>
      <red>
        <start>0</start>
        <end>250</end>
      </red>
      <amber>
        <start>251</start>
        <end>400</end>
      </amber>
      <green>
        <start>401</start>
        <end>500</end>
      </green>
    </range>
    <measure>
      <current>
        <start>0</start>
        <end>230</end>
      </current>
    </measure>
    <comparative>
      <point>450</point>
    </comparative>
  </item>
  <item>
    <label>Cust Sat</label>
    <sublabel>Top Rating of 5</sublabel>
    <axis>
      <point>0</point>
      <point>1</point>
      <point>2</point>
      <point>3</point>
      <point>4</point>
      <point>5</point>
    </axis>
    <range>
      <red>
        <start>0</start>
        <end>3.3</end>
      </red>
      <amber>
        <start>3.4</start>
        <end>4.25</end>
      </amber>
      <green>
        <start>4.26</start>
        <end>5</end>
      </green>
    </range>
    <measure>
      <current>
        <start>0</start>
        <end>4.6</end>
      </current>
    </measure>
    <comparative>
      <point>4.3</point>
    </comparative>
  </item>
</root>
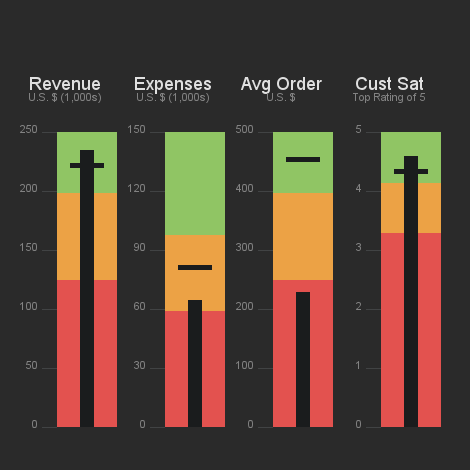
You can only display a single bullet graph in a 1×2 or 2×1 widget.
However, you can display up to 4 bullet graphs in a 2×2 widget by
specifying multiple bullets under the item key.
Funnel
{
  "item":[
    {
      "value":"87809",
      "label":"Step1"
    },
    {
      "value":"70022",
      "label":"Step2"
    },
    {
      "value":"63232",
      "label":"Step 3"
    },
    {
      "value":"53232",
      "label":"Step 4"
    },
    {
      "value":"32123",
      "label":"Step 5"
    },
    {
      "value":"23232",
      "label":"Step 6"
    },
    {
      "value":"12232",
      "label":"Step 7"
    },
    {
      "value":"2323",
      "label":"Step 8"
    }
  ]
}
<?xml version="1.0" encoding="UTF-8"?>
<root>
  <item>
    <value>87809</value>
    <label>Step 1</label>
  </item>
  <item>
    <value>70022</value>
    <label>Step 2</label>
  </item>
  <item>
    <value>63232</value>
    <label>Step 3</label>
  </item>
  <item>
    <value>53232</value>
    <label>Step 4</label>
  </item>
  <item>
    <value>32123</value>
    <label>Step 5</label>
  </item>
  <item>
    <value>23232</value>
    <label>Step 6</label>
  </item>
  <item>
    <value>12232</value>
    <label>Step 7</label>
  </item>
  <item>
    <value>2323</value>
    <label>Step 8</label>
  </item>
</root>
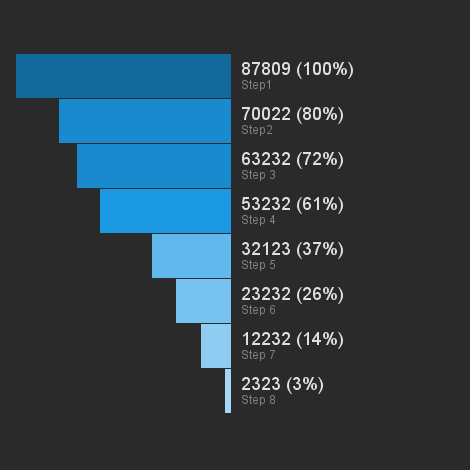
The funnel visualization allows you to show how a number of stages (typically called a funnel) are performing. A good example of this would be the number of users who do the following on a website:
- Visit your website
- Sign up for a free trial
- Convert to a paying customer
A funnel only really makes sense if the number of "things" happening at each stage decreases or stays constant at each stage.
Supported sizes
- 2 x 1 (this funnel only has 3 stages)
- 2 x 2 (this funnel can have between 3 and 8 stages)
Parameters
itemrequired- This is an ordered array of objects. Each object is a subsequent step down the funnel which expects the parameters
value(required) and an optionallabel.
percentageoptional- If this is set to
hidethen the percentage values will be hidden from the visualization.
Gauge
{
  "item": 23,
  "min": {
    "value": 10
  },
  "max": {
    "value": 30
  }
}
<?xml version="1.0" encoding="UTF-8"?>
<root>
  <item>23</item>
  <min>
    <value>10</value>
  </min>
  <max>
    <value>30</value>
  </max>
</root>
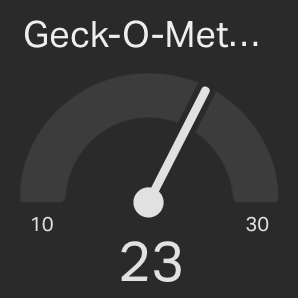
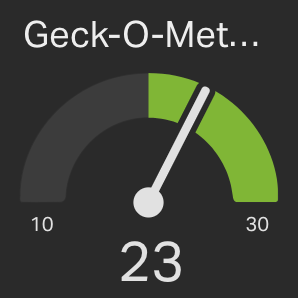
The Gauge widget is used to display a numeric value within the context of its minimum/maximum range.
An example of this would be a Gauge displaying the number of current visitors on a particular website, where the minimum and maximum values could represent the smallest and largest number of concurrent visitors seen within a particular time range (such as the last 24 hours).
Supported sizes
- 1 x 1
- 2 x 2
Parameters
item- A numeric parameter representing the current value of the Gauge.
min/max- The required sections
minandmaxprovide the data for the minimum and maximum value of the Gauge, respectively.
value- The numeric value for the minimum/maximum value of the Gauge.
formatoptional- If given, this string will represent the format of the Gauge value and min/max and they will be displayed accordingly. Possible values are
"percent"and"currency".
unitoptional- When the format is
currencythis must be an ISO 4217 currency code. E.g."GBP","USD","EUR"
Goals
You can add an optional goal from the Set up Widget screen in the app.

Highcharts
Highcharts is a powerful charting library that supports many different ways of visualising data. Use this if you're trying to visualise in a way that isn't supported in the other visualizations. Bear in mind that Highcharts can be quite difficult to configure correctly, and that only the core Highcharts library is supported. See the 'Known Limitations' section for full compatibility information.
Supported sizes
- 1 x 1
- 2 x 1
- 1 x 2
- 2 x 2
- 3 x 2
- 4 x 2
Known Limitations
- We currently support the following chart types:
- Line
- Spline
- Area
- Areaspline
- Column
- Bar
- Pie
- Scatter
- Highcharts plugins and extensions - for example
highcharts-more.js- are not supported at this time.
Parameters
The payload for this visualization is based on the structure you would use if you were using Highcharts in your own JavaScript. For more details, see the official Highcharts documentation.
One thing to note is that it is JavaScript, not JSON:
{
  chart: {
    renderTo: 'container'
  },
  credits: {
    enabled: false
  },
  series: {
    // YOUR DATA POINTS HERE
  }
}
See the Highcharts options reference for complete documentation and view their chart demo gallery to get an idea of the types of charts you can create in Geckoboard.
Push API Usage
For Push widgets, the JavaScript definition needs to be converted to a string and then passed in as the value to a key called highchart. Please note that all strings inside the JavaScript payload need to be escaped.
{
  "api_key": "YOUR_API_KEY",
  "data": {
    "highchart": "{\"chart\": {\"renderTo\": \"container\", ...}, \"series\": {...}"
  }
}
Here’s a quick example of how to push some data via cURL:
curl https://push.geckoboard.com/v1/send/[WIDGET ID] -d '{"api_key":"[API KEY]", "data":{"highchart": "{chart:{style: {color: \"#b9bbbb\"},renderTo:\"container\",backgroundColor:\"transparent\",lineColor:\"rgba(35,37,38,100)\",plotShadow: false,},credits:{enabled:false},title:{style: {color: \"#b9bbbb\"},text:\"Monthly Average Temperature\"},xAxis:{categories:[\"Jan\",\"Feb\",\"Mar\",\"Apr\",\"May\",\"Jun\",\"Jul\",\"Aug\",\"Sep\",\"Oct\",\"Nov\",\"Dec\"]},yAxis:{title:{style: {color: \"#b9bbbb\"}, text:\"Temperature\"}},legend:{itemStyle: {color: \"#b9bbbb\"}, layout:\"vertical\",align:\"right\",verticalAlign:\"middle\",borderWidth:0},series:[{color:\"#108ec5\",name:\"NewYork\",data:[17.0,22.0,24.8,24.1,20.1,14.1,8.6,2.5]},{color:\"#52b238\",name:\"Berlin\",data:[13.5,17.0,18.6,17.9,14.3,9.0,3.9,1.0]},{color:\"#ee5728\",name:\"London\",data:[11.9,15.2,17.0,16.6,14.2,10.3,6.6,4.8]}]}"}}'
Highcharts Example
{
  chart: {
    style: {
      color: "#b9bbbb"
    },
    renderTo: "container",
    backgroundColor: "transparent",
    lineColor: "rgba(35,37,38,100)",
    plotShadow: false
  },
  credits: {
    enabled: false
  },
  title: {
    style: {
      color: "#b9bbbb"
    },
    text: "Monthly Average Temperature"
  },
  xAxis: {
    categories: ["Jan", "Feb", "Mar", "Apr", "May", "Jun", "Jul", "Aug", "Sep", "Oct", "Nov", "Dec"]
  },
  yAxis: {
    title: {
      style: {
        color: "#b9bbbb"
      },
      text: "Temperature"
    }
  },
  legend: {
    itemStyle: {
      color: "#b9bbbb"
    },
    layout: "vertical",
    align: "right",
    verticalAlign: "middle",
    borderWidth: 0
  },
  series: [{
    color: "#108ec5",
    name: "NewYork",
    data: [17.0, 22.0, 24.8, 24.1, 20.1, 14.1, 8.6, 2.5]
  }, {
    color: "#52b238",
    name: "Berlin",
    data: [13.5, 17.0, 18.6, 17.9, 14.3, 9.0, 3.9, 1.0]
  }, {
    color: "#ee5728",
    name: "London",
    data: [11.9, 15.2, 17.0, 16.6, 14.2, 10.3, 6.6, 4.8]
  }]
}
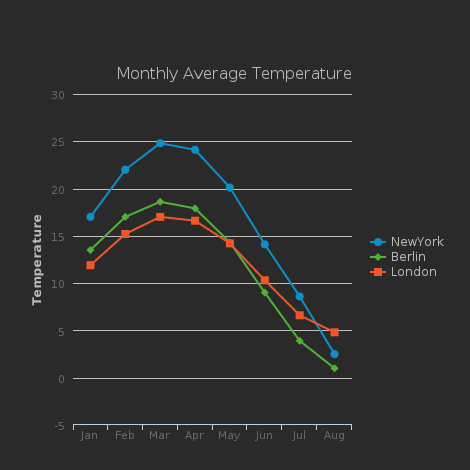
This is an example of a Highchart-powered line plot that displays the monthly average temperature for 3 distinct cities.
Leaderboard
{
  "items": [
    {
      "label": "Peter",
      "value": 234,
      "previous_rank": 2
    },
    {
      "label": "Patrick",
      "value": 232,
      "previous_rank": 1
    },
    {
      "label": "Jon",
      "value": 230
    },
    {
      "label": "Clara",
      "value": 220
    },
    {
      "label": "Tom",
      "value": 215,
      "previous_rank": 7
    },
    {
      "label": "Sylvester",
      "value": 200
    },
    {
      "label": "David",
      "value": 195,
      "previous_rank": 5
    },
    {
      "label": "Matt",
      "value": 190
    },
    {
      "label": "William",
      "value": 185
    },
    {
      "label": "Rose",
      "value": 182,
      "previous_rank": 11
    },
    {
      "label": "Colin",
      "value": 178,
      "previous_rank": 10
    },
    {
      "label": "Paul",
      "value": 172
    },
    {
      "label": "Amy",
      "value": 166
    },
    {
      "label": "Christopher",
      "value": 162
    }
  ]
}
<?xml version="1.0" encoding="UTF-8" ?>
<root>
  <items>
    <label>Peter</label>
    <value>234</value>
    <previous_rank>2</previous_rank>
  </items>
  <items>
    <label>Patrick</label>
    <value>232</value>
    <previous_rank>1</previous_rank>
  </items>
  <items>
    <label>Jon</label>
    <value>230</value>
  </items>
  <items>
    <label>Clara</label>
    <value>220</value>
  </items>
  <items>
    <label>Tom</label>
    <value>215</value>
    <previous_rank>7</previous_rank>
  </items>
  <items>
    <label>Sylvester</label>
    <value>200</value>
  </items>
  <items>
    <label>David</label>
    <value>195</value>
    <previous_rank>5</previous_rank>
  </items>
  <items>
    <label>Matt</label>
    <value>190</value>
  </items>
  <items>
    <label>William</label>
    <value>185</value>
  </items>
  <items>
    <label>Rose</label>
    <value>182</value>
    <previous_rank>11</previous_rank>
  </items>
  <items>
    <label>Colin</label>
    <value>178</value>
    <previous_rank>10</previous_rank>
  </items>
  <items>
    <label>Paul</label>
    <value>172</value>
  </items>
  <items>
    <label>Amy</label>
    <value>166</value>
  </items>
  <items>
    <label>Christopher</label>
    <value>162</value>
  </items>
</root>
Supported sizes
- 1 × 1
- 1 × 2
- 1 × 3
- 1 × 4
- 2 × 2
- 2 × 3
- 2 × 4
Parameters
items
A list of up to 22 items. These specify the label and optionally
value and previous_rank of each item in the Leaderboard.
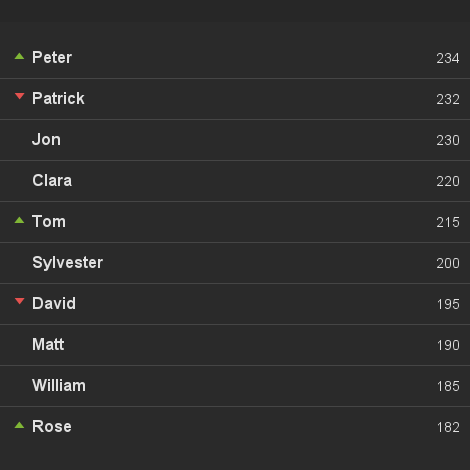
Rank order will follow the order of items in the list.
The following table lists how many items will be displayed for each available widget height.
| Height | Max Items |
|---|---|
| 1 | 4 |
| 2 | 10 |
| 3 | 16 |
| 4 | 22 |
label- The text to display – Only plain text is supported, so no HTML.
value- optional Useful for giving some context to the ranking. E.g. Total sales this month. If a number is passed it will be formatted according to your browser's locale.
previous_rank- optional The previous rank of this item (1-indexed). This will be used to indicate the last movement of this item in the rankings.
format
optional Possible values are "decimal", "percent" and "currency". The default is "decimal".
unit
optional When the format is currency this must be an ISO 4217 currency code. E.g. "GBP", "USD", "EUR"
Formatting values
{
  "format": "currency",
  "unit": "GBP",
  "items": [
    {
      "label": "Peter",
      "value": 234.4
    },
    {
      "label": "Patrick",
      "value": 232
    },
    {
      "label": "Jon",
      "value": 230.45
    },
    {
      "label": "Clara",
      "value": 220
    },
    {
      "label": "Tom",
      "value": 215.578
    },
    {
      "label": "Sylvester",
      "value": 200
    },
    {
      "label": "David",
      "value": 195
    },
    {
      "label": "Matt",
      "value": 190
    },
    {
      "label": "William",
      "value": 185.679
    },
    {
      "label": "Rose",
      "value": 182
    }
  ]
}
<?xml version="1.0" encoding="UTF-8" ?>
<root>
  <format>currency</format>
  <unit>GBP</unit>
  <items>
    <label>Peter</label>
    <value>234</value>
  </items>
  <items>
    <label>Patrick</label>
    <value>232</value>
  </items>
  <items>
    <label>Jon</label>
    <value>230.45</value>
  </items>
  <items>
    <label>Clara</label>
    <value>220</value>
  </items>
  <items>
    <label>Tom</label>
    <value>215.578</value>
  </items>
  <items>
    <label>Sylvester</label>
    <value>200</value>
  </items>
  <items>
    <label>David</label>
    <value>195</value>
  </items>
  <items>
    <label>Matt</label>
    <value>190</value>
  </items>
  <items>
    <label>William</label>
    <value>185.679</value>
  </items>
  <items>
    <label>Rose</label>
    <value>182</value>
  </items>
</root>
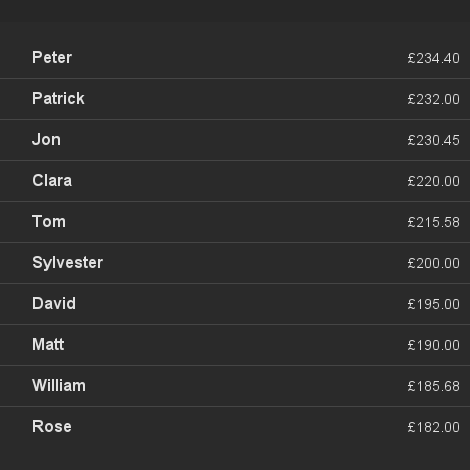
If a value is numeric we will attempt to format it to your browser's locale settings using the formatting options you provide.
Line Chart
{
  "y_axis": {
    "format": "currency",
    "unit": "USD"
  },
  "series": [
    {
      "name": "GBP -> USD",
      "data": [
        1.62529,
        1.56991,
        1.50420,
        1.52265,
        1.55356,
        1.51930,
        1.52148,
        1.51173,
        1.55170,
        1.61966,
        1.59255,
        1.63762
      ]
    }
  ]
}
<?xml version="1.0" encoding="UTF-8"?>
<root>
  <y_axis>
    <format>currency</format>
    <unit>USD</unit>
  </y_axis>
  <series>
    <name>GBP -> USD</name>
    <data>1.62529</data>
    <data>1.56991</data>
    <data>1.50420</data>
    <data>1.52265</data>
    <data>1.55356</data>
    <data>1.51930</data>
    <data>1.52148</data>
    <data>1.51173</data>
    <data>1.55170</data>
    <data>1.61966</data>
    <data>1.59255</data>
    <data>1.63762</data>
  </series>
</root>
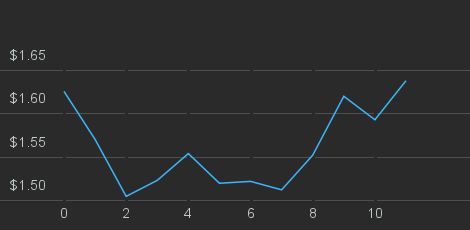
The line chart visualization is best suited for showing how one or more metrics change over time.
An example use would be displaying the number of website visitors per day, or sales per month.
The following covers version 2 of our line chart visualization. If you're looking for documentation on the version 1 API format, please refer to the archive.
Supported sizes
The line chart visualization supports all available sizes.
Parameters
series
An array of one or more data series objects. Each series will correspond to a separate line in the chart. The following options are available for each series:
data- An array of data points for the line chart. Each data point may be given as a single number (e.g.
[3, 5, 8]), or as a two-element array specifying both X and Y axis values, respectively (e.g.[[0, 1], [1, 5], [2, 25]]). While the Y axis value must be a number, the X axis value may be a string, if thedatetimeoption is used. See the datetime example below for details.
nameoptional- An optional string indicating the name of the series. This will be displayed in the line chart's legend.
incomplete_fromoptional- This option will mark the series as incomplete from that point onwards. This is useful, for example, for displaying visitors per day to a website, while making it clear that today's data doesn't yet correspond to the full time interval. Note that
incomplete_fromincludes the value provided, as well as any subsequent ones and is only available when using scatter-style charts. See the datetime example below for an example of this property in use.
typeoptional- Can be either
"main", or"secondary", defaults to"main"if not specified. A series of type"main"will be represented by a solid line in the chart, will be labelled in the legend, and can have a goal state. A"secondary"series will have a grey dashed line, will not show up in the legend, and cannot have a goal state."secondary"series are useful for comparing current performance to previous values. For example, comparing revenue from this month (the"main"series), to last month's revenue (the"secondary"series).
x_axis
Optional configuration options for the X axis.
labelsoptional- An array of strings, or numbers, to be used for populating simple line charts. Providing labels for a scatter-style plot will result in an error.
typeoptional- Specifying the string
"datetime"will cause all X axis values to be interpreted as an ISO 8601 date/time. Partial dates (e.g.2014-10for October 2014) are supported. See below for details on how datetimes are rendered on the chart. Leavingtypeempty or setting it tostandardwill cause X values to be interpreted the usual way.
y_axis
Optional configuration options for the Y axis.
formatoptional- If given, this string will represent the format of the Y axis and will be displayed accordingly. Possible values are
"decimal","percent"and"currency". The default is"decimal".
unitoptional- When the format is
currencythis must be an ISO 4217 currency code. E.g."GBP","USD","EUR"
Notes on datetime handling
Rendered precision
When x-values are provided as datetimes, the line chart optimises the level of precision displayed on the x-axis based on the size of the widget and the overall time span.
Timezones
If values of time are provided, e.g. "2015-09-15T13:00", the dashboard will treat these as local to the dashboard's time zone setting and will not adjust them. That is, no matter what the dashboard's time zone is configured to, the values will remain the same.
If you would like the dashboard to adjust the values relative to its configured time zone, an ISO 8601 time zone identifier must be appended to the time string, such as "2015-09-15T13:00Z" or "2015-09-15T13:00+00:00" where here the "Z" or "00:00" indicates UTC.
For example, if the dashboard's time zone were set to Honolulu, the datetime value of "2015-09-15T13:00+00:00", which is UTC, would be converted to and displayed as the local time of "2015-09-15T02:00".
Simple Example
{
  "x_axis": {
    "labels": [
      "Jan", "Feb", "Mar", "Apr",
      "May", "Jun", "Jul", "Aug",
      "Sep", "Oct", "Nov", "Dec"
    ]
  },
  "series": [
    {
      "name": "GBP -> USD",
      "data": [
        1.62529, 1.56991, 1.50420, 1.52265,
        1.55356, 1.51930, 1.52148, 1.51173,
        1.55170, 1.61966, 1.59255, 1.63762
      ]
    },
    {
      "name": "GBP -> EUR",
      "data": [
        1.23226, 1.15025, 1.15501, 1.18526,
        1.18137, 1.16923, 1.16434, 1.14420,
        1.17542, 1.19759, 1.18098, 1.20513
      ]
    }
  ]
}
<?xml version="1.0" encoding="UTF-8"?>
<root>
  <x_axis>
    <labels>Jan</labels>
    <labels>Feb</labels>
    <labels>Mar</labels>
    <labels>Apr</labels>
    <labels>May</labels>
    <labels>Jun</labels>
    <labels>Jul</labels>
    <labels>Aug</labels>
    <labels>Sep</labels>
    <labels>Oct</labels>
    <labels>Nov</labels>
    <labels>Dev</labels>
  </x_axis>
  <series>
    <name>GBP -> USD</name>
    <data>1.62529</data>
    <data>1.56991</data>
    <data>1.50420</data>
    <data>1.52265</data>
    <data>1.55356</data>
    <data>1.51930</data>
    <data>1.52148</data>
    <data>1.51173</data>
    <data>1.55170</data>
    <data>1.61966</data>
    <data>1.59255</data>
    <data>1.63762</data>
  </series>
  <series>
    <name>GBP -> EUR</name>
    <data>1.23226</data>
    <data>1.15025</data>
    <data>1.15501</data>
    <data>1.18526</data>
    <data>1.18137</data>
    <data>1.16923</data>
    <data>1.16434</data>
    <data>1.14420</data>
    <data>1.17542</data>
    <data>1.19759</data>
    <data>1.18098</data>
    <data>1.20513</data>
  </series>
</root>
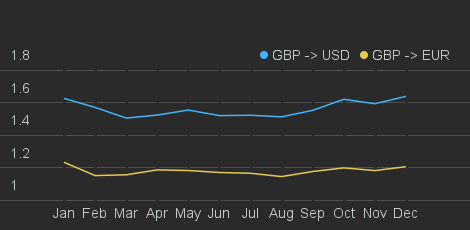
This example demonstrates the usage of "simple" data series: that is,
the ones without explicit X axis values. The optional labels option
for the X axis is used to add a caption for the month name at the right
intervals.
Labels Example
{
  "x_axis": {
    "labels": ["May", "Jun", "Jul", "Aug", "Sep"]
  },
  "series": [
    {
      "data": [
        10, 2, 24, 18, 35
      ]
    }
  ]
}
<?xml version="1.0" encoding="UTF-8"?>
<root>
  <x_axis>
    <labels>May</labels>
    <labels>Jun</labels>
    <labels>Jul</labels>
    <labels>Aug</labels>
    <labels>Sep</labels>
  </x_axis>
  <series>
    <data>10</data>
    <data>2</data>
    <data>24</data>
    <data>18</data>
    <data>35</data>
  </series>
</root>
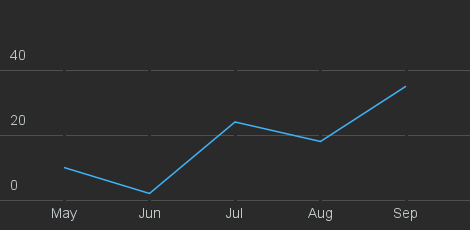
When specifying labels for the values on the x-axis, the label array should only contain strings.
Scatter Example
{
  "series": [
    {
      "name": "sin(x)",
      "data": [
        [0, 0],
        [0.785, 0.5],
        [1.57, 1],
        [2.093, 0.5],
        [3.14, 0]
      ]
    },
    {
      "name": "cos(x)",
      "data": [
        [0, 1],
        [0.785, 0.5],
        [1.57, 0],
        [2.093, 0.5],
        [3.14, 1]
      ]
    }
  ]
}
<?xml version="1.0" encoding="UTF-8"?>
<root>
  <series>
    <name>sin(x)</name>
    <data><x>0</x><y>0</y></data>
    <data><x>0.785</x><y>0.5</y></data>
    <data><x>1.57</x><y>1</y></data>
    <data><x>2.093</x><y>0.5</y></data>
    <data><x>3.14</x><y>0</y></data>
  </series>
  <series>
    <name>cos(x)</name>
    <data><x>0</x><y>1</y></data>
    <data><x>0.785</x><y>0.5</y></data>
    <data><x>1.57</x><y>0</y></data>
    <data><x>2.093</x><y>0.5</y></data>
    <data><x>3.14</x><y>1</y></data>
  </series>
</root>
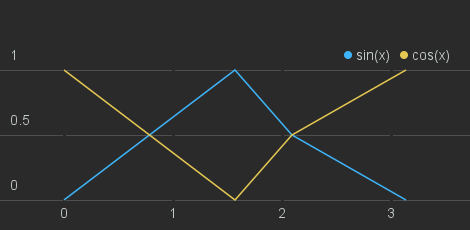
This example shows how pairs of [X, Y] data points may be provided. Note that these may come in any order, and that the X values may be different or missing across multiple data series.
Datetime example
{
  "x_axis": {
    "type": "datetime"
  },
  "series": [
    {
      "name": "Visitors per month",
      "data": [
        ["2014-01", 71173],
        ["2014-02", 57624],
        ["2014-03", 64851],
        ["2014-04", 60486],
        ["2014-05", 60500],
        ["2014-06", 62908],
        ["2014-07", 64818],
        ["2014-08", 59961],
        ["2014-09", 58542],
        ["2014-10", 22050]
      ],
      "incomplete_from": "2014-10"
    }
  ]
}
<?xml version="1.0" encoding="UTF-8"?>
<root>
  <x_axis>
    <type>datetime</type>
  </x_axis>
  <series>
    <name>Visitors per month</name>
    <data><x>2014-01</x><y>71173</y></data>
    <data><x>2014-02</x><y>57624</y></data>
    <data><x>2014-03</x><y>64851</y></data>
    <data><x>2014-04</x><y>60486</y></data>
    <data><x>2014-05</x><y>60500</y></data>
    <data><x>2014-06</x><y>62908</y></data>
    <data><x>2014-07</x><y>64818</y></data>
    <data><x>2014-08</x><y>59961</y></data>
    <data><x>2014-09</x><y>58542</y></data>
    <data><x>2014-10</x><y>22050</y></data>
    <incomplete_from>2014-10</incomplete_from>
  </series>
</root>
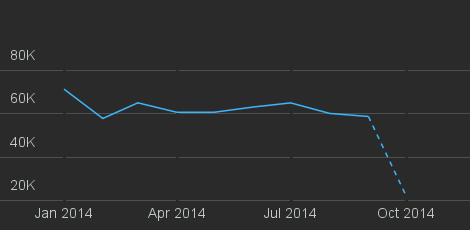
Setting the X axis' type option to "datetime" allows for strings to
be provided as the X axis value of each of the data points. All strings
must be valid ISO 8601
specifiers. The data points may come in any order, and they will be
sorted from earliest to latest. Formatting of the X axis labels will
depend on the granularity of the data: points separated by a few minutes
will be displayed as time of day, whereas longer intervals may be
displayed as dates, months, or years.
Note that the incomplete_from option causes the line to be dotted for
data points starting from (and including) October 2014, indicating that
the value is not yet final.
List
[
  {
    "title": {
      "text": "Chrome"
    },
    "label": {
      "name": "New!",
      "color": "#ff2015"
    },
    "description": "40327 visits"
  },
  {
    "title": {
      "text": "Safari"
    },
    "description": "11577 visits"
  },
  {
    "title": {
      "text": "Firefox"
    },
    "description": "10296 visits"
  },
  {
    "title": {
      "text": "Internet Explorer"
    },
    "description": "3587 visits"
  },
  {
    "title": {
      "text": "Opera"
    },
    "description": "499 visits"
  }
]
<?xml version="1.0" encoding="UTF-8" ?>
<root>
  <item>
    <title>
      <text>Chrome</text>
    </title>
    <label>
      <name>New!</name>
      <color>#ff2015</color>
    </label>
    <description>40327 visits</description>
  </item>
  <item>
    <title>
      <text>Safari</text>
    </title>
    <description>11577 visits</description>
  </item>
  <item>
    <title>
      <text>Firefox</text>
    </title>
    <description>10296 visits</description>
  </item>
  <item>
    <title>
      <text>Internet Explorer</text>
    </title>
    <description>3587 visits</description>
  </item>
  <item>
    <title>
      <text>Opera</text>
    </title>
    <description>499 visits</description>
  </item>
</root>
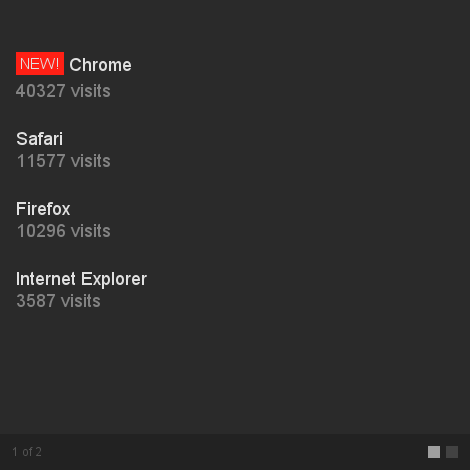
The list widget displays a paginated list of text lines.
An example of this would be a List to show the top domains referring traffic to your site.
The list widget can paginate between 1 and 9 pages. A different number of elements is displayed on each page depending on the size of the widget.
Supported sizes
- 1 × 1
- 2 × 1
- 2 × 2
Parameters
Each object must have a title key with at least a text attribute.
text- The text to display – Only text data is supported, so no HTML.
name- optional The label is only visible in 2×2 sized widgets and lets you display a label in front of the title with a background colour of your choice.
color- optional Accepts every valid CSS colour (#f1e, red… default value is #b5712b).
description- optional The description defines the sub-text displayed under the title.
Map
{
  "points": {
    "point": [
      {
        "city": {
          "city_name": "London",
          "country_code": "GB"
        },
        "size": 10
      },
      {
        "city": {
          "city_name": "San Francisco",
          "country_code": "US",
          "region_code": "CA"
        }
      },
      {
        "latitude": "22.2670",
        "longitude": "114.1880",
        "color": "d8f709"
      },
      {
        "latitude": "-33.94336",
        "longitude": "18.896484",
        "size": 5
      },
      {
        "host": "geckoboard.com",
        "color": "77dd77",
        "size": 6
      },
      {
        "ip": "178.125.193.227"
      }
    ]
  }
}
<?xml version="1.0" encoding="UTF-8"?>
<root>
  <points>
    <point>
      <city>
        <city_name>London</city_name>
        <country_code>GB</country_code>
      </city>
      <size>10</size>
    </point>
    <point>
      <city>
        <city_name>San Francisco</city_name>
        <country_code>US</country_code>
        <region_code>CA</region_code>
      </city>
    </point>
    <point>
      <latitude>51.526263</latitude>
      <longitude>-0.092429</longitude>
      <color>d8f709</color>
    </point>
    <point>
      <latitude>-33.94336</latitude>
      <longitude>18.896484</longitude>
    </point>
    <point>
      <host>geckoboard.com</host>
    </point>
    <point>
      <ip>178.125.193.227</ip>
    </point>
  </points>
</root>
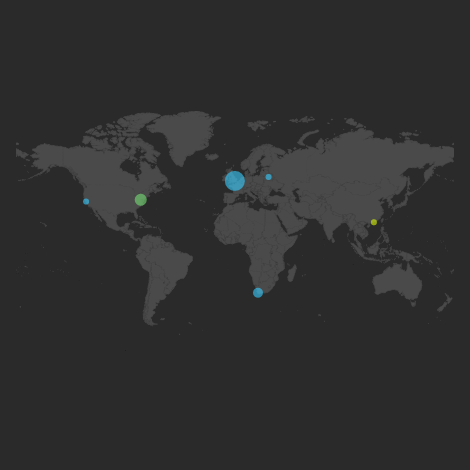
The Map widget provides a way to display geographical locations as points on a map. Each Map widget is configured for a particular region of the world, include the entire world map. Points that are located outside the bounds of the chosen region will simply be ignored.
Locations may be specified as latitude/longitude pairs, city names, hostnames or IP addresses.
Supported sizes
- 2 x 2
- 3 x 3
- 4 x 2
- 4 x 3
- 4 x 4
Parameters
Inside the points section, the point parameter may take one of the four different forms below.
City name and region
{
  "points": {
    "point": [{
      "city": {
        "city_name": "San Francisco",
        "country_code": "US",
        "region_code": "CA"
      }
    }]
  }
}
<?xml version="1.0" encoding="UTF-8"?>
<root>
  <points>
    <point>
      <city>
        <city_name>San Francisco</city_name>
        <country_code>US</country_code>
        <region_code>CA</region_code>
      </city>
    </point>
  </points>
</root>
In order to specify the location of a particular city, it must be identified by its name and country. Optionally, the region it belongs to, such as a US state, may also be specified, in order to resolve ambiguities.
The city_name parameter is a string representing the common name for the city, such as "San Francisco". The country_code parameter must be a string containing the two-letter ISO 3166 code for the country that the city belongs to, such as "US" for the United States. A table listing all valid country codes is available on Wikipedia, under the "Code" column.
In addition, a region_code string parameter may optionally be specified, containing a two-letter representation of the region that the city belongs to. This can be used to distinguish between two or more identically named cities in the same country.
If the city is in the United States, region_code (if given) must be a valid ISO 3166-2 code, such as "CA" for California. A full list of ISO 3166-2 codes for the USA is available on Wikipedia.
If the city is not in the United States, the two-letter FIPS region code should be used instead, such as "P5" for the City of Westminster, London. A full list of FIPS region codes, broken up by countries, is available on Wikipedia.
Latitude and Longitude
{
  "points": {
    "point": [
      {
        "latitude": 37.7577,
        "longitude": "-122.4376"
      }
    ]
  }
}
<?xml version="1.0" encoding="UTF-8"?>
<root>
  <points>
    <point>
      <latitude>37.7577</latitude>
      <longitude>-122.4376</longitude>
    </point>
  </points>
</root>
The location of the point may also be specified as a latitude / longitude pair. Both values can be given as either numbers(e.g.JSON floating point numerals) or strings containing a number.
Host
{
  "points": {
    "point": [
      {
        "host": "geckoboard.com"
      }
    ]
  }
}
<?xml version="1.0" encoding="UTF-8"?>
<root>
  <points>
    <point>
      <host>geckoboard.com</host>
    </point>
  </points>
</root>
A hostname may also be specified, using the host string parameter. Geckoboard will attempt to locate its geographical position and display it on the map.
IP Address
{
  "points": {
    "point": [
      {
        "ip": "207.97.227.239"
      }
    ]
  }
}
<?xml version="1.0" encoding="UTF-8"?>
<root>
  <points>
    <point>
      <ip>207.97.227.239</ip>
    </point>
  </points>
</root>
An IP address may also be specified using the ip string parameter. This may be useful, for example, when building a Map widget to plot the location of current visitors to a particular website, using the IP address that they're connecting from.
Additional Parameters
{
  "points": {
    "point": [
      {
        "city": {
          "city_name": "San Francisco",
          "country_code": "US"
        },
        "size": 2,
        "color": "d8f709"
      }
    ]
  }
}
<?xml version="1.0" encoding="UTF-8"?>
<root>
  <points>
    <point>
      <city>
        <city_name>San Francisco</city_name>
        <country_code>US</country_code>
      </city>
      <size>2</size>
      <color>d8f709 </color>
    </point>
  </points>
</root>
sizeoptional- Each point on the map can have a different size, which is represented as a smaller or larger circle. The minimum size for a point is 1, and the maximum is 10. By default, each point has size 3, but a different value can be specified using the numeric parameter
size.
coloroptional- It is also possible to specify a different colour for each point on the map, by setting the optional
colorstring parameter to the desired hexadecimal colour value.
Monitoring
{
  "status": "Up",
  "downTime": "9 days ago",
  "responseTime": "593 ms"
}
<?xml version="1.0" encoding="UTF-8"?>
<root>
  <status>Up</status>
  <downTime>9 days ago</downTime>
  <responseTime>593 ms</responseTime>
</root>
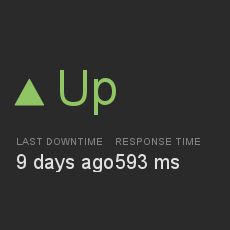
The Monitoring widget is used to display whether a particular resource or service (such as your company website) is currently reachable.
It consists of a colour-coded Up/Down arrow, as well as additional (optional) fields for the service's response time and when the most recent downtime occurred.
Supported sizes
- 1 x 1
- 2 x 2
Parameters
status- A string parameter indicating whether the service is up or down. If the value is Up (or any case-insensitive combination thereof), the text will be coloured green, and an upward-pointing arrow will be displayed. If the value is Down, the text will be red, and a downward-pointing arrow will be displayed. If the value is Unreported, the text will be white, and no arrow will be displayed.
downTime- optional A string indicating when the last downtime happened. If status is Down, then this value will be ignored, and displayed as NOW. Omitting this value will display a hyphen in its place.
responseTime- optional A string indicating the current response time for the service. Omitting this value will display a hyphen in its place.
Down Example
{
  "status": "Down",
  "downTime": "2 days ago",
  "responseTime": "593 ms"
}
<?xml version="1.0" encoding="UTF-8"?>
<root>
  <status>Down</status>
  <downTime>2 days ago</downTime>
  <responseTime>593 ms</responseTime>
</root>
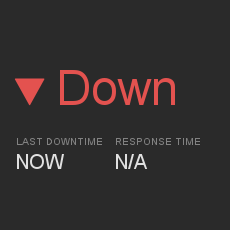
This is an example of a monitoring widget in the "Down" state. The
values of the downTime and responseTime parameters are ignored, and
"NOW" and "N/A" is displayed, respectively.
Number and Secondary Stat
{
  "item": [
    {
      "value": 5723,
      "text": "Total paying customers"
    }
  ]
}
<?xml version="1.0" encoding="UTF-8"?>
<root>
  <item>
    <value>5723</value>
    <text>Total paying customers</text>
  </item>
</root>
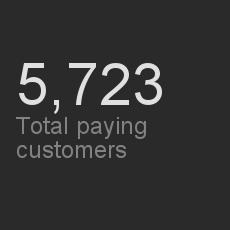
The Number and Secondary Stat visualization is focused on the display of a metric that can be represented by a single number, along with associated secondary metrics, such as a change or trend indication.
Use this visualization when the number is the most important aspect of the metric you're trying to display, such as today's sales, or yesterday's website uniques. The secondary statistic can then be used to give context to the current value.
Supported sizes
- 1 x 1
- 2 x 2
Parameters
item
The item parameter is an array, where the first element represents the primary metric to display, and the second, optional, element represents the secondary comparison metric. If the latter is an array of numbers, it is interpreted as a trendline. If it's an object, then it should contain the same parameters as the primary metric, described as follows.
value- For the first
itemsection, this parameter describes the primary metric and should be a number. For the seconditemsection (comparative display) this shows the comparison value. The primary number is formatted according to the usual formatting rules.
textoptional- For a 2 x 2 widget you can show a label next to the primary value. For a 1 x 1 if you exclude a number from the second item you can specify a text label instead.
prefixoptional- If the number you wish to display has units then you can set a prefix value. This can be a currency symbol such as
$,£or€. The visualization will automatically convert a prefix of%to a suffix.
typeoptional- As well as a number, you can also display other number-like metrics. Possible values are
time_durationandtext.
time_durationdisplays a time duration instead of a number for both the primary and the secondary values, by interpreting the numeric value as the number of milliseconds in the time period.
For example,565000(ms) would be displayed as9m 25s(9 minutes 25 seconds).
textdisplays the primary metric as text instead of a number. This is useful, for example, when you would like to display a value with a custom unit.
type
Set this parameter's value to "reverse" to flip the colours of the up/down arrow on the comparison metric so that up is red and down is green. See the Reverse Example below.
absolute
If you're using the comparative option, setting the optional absolute parameter to true will mean the difference is displayed as an absolute value rather than a percentage. This is useful if the comparative value itself is useful for people to know about. For example, displaying units shipped today vs yesterday as absolute values gives you a good indicator of the extra number of units you need to purchase to refill the stock.
Goals
You can add an optional goal from the Set up Widget screen in the app. Adding a goal will replace any other secondary stat that you provide.

Comparison Example
{
  "item": [
    {
      "value": 142
    },
    {
      "value": 200
    }
  ]
}
<?xml version="1.0" encoding="UTF-8"?>
<root>
  <item>
    <value>142</value>
    <text></text>
  </item>
  <item>
    <value>200</value>
    <text></text>
  </item>
</root>
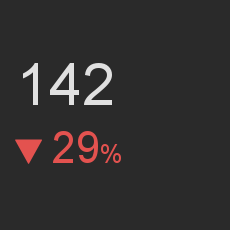
This example shows a simple number widget with a secondary metric that the primary value is compared to. The comparison is displayed as a percentage and colour-coded according to whether the primary metric is an increase or a decrease over the secondary metric.
Set the type parameter to "reverse", as described above, to invert
red and green.
Trendline Example
{
  "item": [
    {
      "value": "274057"
    },
    [
      "38594",
      "39957",
      "35316",
      "35913",
      "36668",
      "45660",
      "41949"
    ]
  ]
}
<?xml version="1.0" encoding="UTF-8"?>
<root>
  <item>
    <value>274057</value>
  </item>
  <item>
    <value>38594</value>
    <value>39957</value>
    <value>35316</value>
    <value>35913</value>
    <value>36668</value>
    <value>45660</value>
    <value>41949</value>
  </item>
</root>
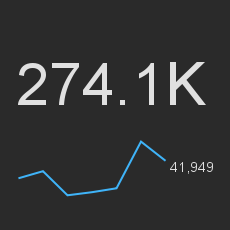
This example shows a number widget with a secondary metric containing an array of numbers, which is displayed as a trendline below.
Absolute Example
{
  "absolute": true,
  "item": [
    {
      "text": "",
      "value": 123
    },
    {
      "text": "",
      "value": 238
    }
  ]
}
<?xml version="1.0" encoding="UTF-8"?>
<root>
  <absolute>true</absolute>
  <item>
    <value>123</value>
    <text></text>
  </item>
  <item>
    <value>238</value>
    <text></text>
  </item>
</root>
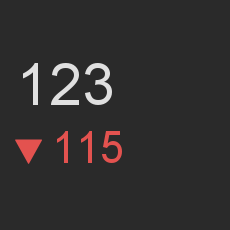
This example shows the behaviour of the secondary (comparative)
metric for number widgets where the absolute parameter is set to
true.
Prefix Example
{
  "item": [
    {
      "text": "Revenue yesterday",
      "value": 123,
      "prefix": "€"
    }
  ]
}
<?xml version="1.0" encoding="UTF-8"?>
<root>
<item>
<value>123</value>
<text>Revenue yesterday</text>
<prefix><![CDATA[€]]></prefix>
</item>
</root>
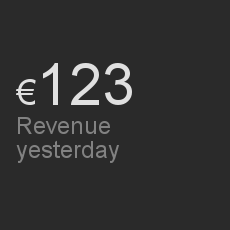
This is an example of a number widget where the prefix parameter for
the primary metric is set to a currency symbol, which is used to
express the unit of the specific numeric value.
Note that for XML widgets, certain currency symbols must be HTML-escaped
and wrapped in a CDATA tag.
Reverse Example
{
    "type": "reverse",
    "item": [
        {
            "value": 565
        },
        {
            "value": 559
        }
    ]
}
<?xml version="1.0" encoding="UTF-8"?>
<root>
  <reverse>true</reverse>
  <item>
    <value>565</value>
    <text></text>
  </item>
  <item>
    <value>559</value>
    <text></text>
  </item>
</root>
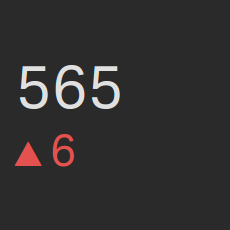
This example shows how the colours of the Up/Down arrow are flipped, so that Up is red (negative) and Down is green (positive). This is helpful, for example, when you are measuring costs, where a lower cost would be desired.
Pie Chart
{
  "item": [
    {
      "value": 100,
      "label": "May",
      "color": "13699c"
    },
    {
      "value": 160,
      "label": "June",
      "color": "198acd"
    },
    {
      "value": 300,
      "label": "July",
      "color": "60b8ec"
    },
    {
      "value": 140,
      "label": "August",
      "color": "a4d7f4"
    }
  ]
}
<?xml version="1.0" encoding="UTF-8"?>
<root>
  <item>
    <value>100</value>
    <label>May</label>
    <color>13699c</color>
  </item>
  <item>
    <value>160</value>
    <label>June</label>
    <color>198acd</color>
  </item>
  <item>
    <value>300</value>
    <label>July</label>
    <color>60b8ec</color>
  </item>
  <item>
    <value>140</value>
    <label>August</label>
    <color>a4d7f4</color>
  </item>
</root>
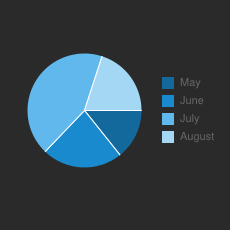
The Pie Chart widget provides a way to segment a total quantity, and show the relative proportions of each segment of the data set.
An example of a pie chart might be to display the proportion of total users visiting a website for each web browser.
Supported sizes
- 1 x 1
- 2 x 2
Parameters
value- The
valueparameter can be a number or numeric string representing the proportion of the pie occupied by the slice.
label- The
labelstring parameter will populate the legend for the slice.
coloroptional- The
colorstring parameter defines the colour of the pie chart slice. It must be given as a hexadecimal colour code, such asd8f709. If provided, the last two hex digits represent the colour transparency:d8f709aawould display the colourd8f709with a transparency value ofaa.
RAG
{
  "item": [
    {
      "value": 16,
      "text": "Long past due"
    },
    {
      "value": 64,
      "text": "Overdue"
    },
    {
      "value": 32,
      "text": "Due"
    }
  ]
}
<?xml version="1.0" encoding="UTF-8"?>
<root>
  <item>
    <value>16</value>
    <text>Long past due</text>
  </item>
  <item>
    <value>64</value>
    <text>Overdue</text>
  </item>
  <item>
    <value>32</value>
    <text>Due</text>
  </item>
</root>
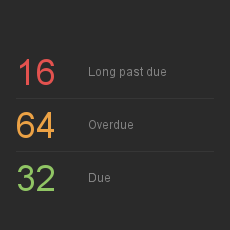
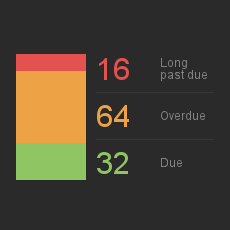
The RAG (Red Amber Green) visualization offers a traffic light view of your data, which is useful when you have two or three figures you wish to compare at a glance.
It would be ideally suited to displaying, for example, the totals of unpaid, paid and pending invoices from your accounting system.
Geckoboard provides two distinct custom widget types for this visualization:
- The RAG number widgets display three colour-coded numeric values, along with a textual label.
- The RAG column and number widget is functionally identical to the RAG number widget, except for an added, colour-coded column which allows you to see how your values are related proportionally. This would be great for tracking your progress through a task list, or for displaying the number of support tickets and their statuses/priorities.
Supported sizes
- 1 x 1
- 2 x 2
Parameters
The RAG widget expects 2 or 3 items. The order of these will determine which colour is applied. The first item being red, the second amber and the third green.
text- A label to indicate what the
valuerepresents.
valueoptional- A number representing the quantity or proportion of the entity being represented. If you omit a
valuethen the corresponding column will not be displayed. This would be useful if you only want to display red and green indicators. If you omit thevaluefor allitems then a blank widget will be displayed.
prefixoptional- A prefix for the
value. This would be ideal for displaying a currency symbol when thevalueis monetary.
typeoptional- The
typeparameter accepts one valuereverse. If supplied then the order of the items will be reversed.
Text
{
  "item": [
    {
      "text": "In warm regions of the world the arrival of a gecko in your home is seen as good luck.",
      "type": 0
    },
    {
      "text": "Geckos can climb vertical surfaces due to their highly specialized toe pads.",
      "type": 1
    }
  ]
}
<?xml version="1.0" encoding="UTF-8"?>
<root>
  <item>
    <text><![CDATA["Unfortunately, as you probably already know, people"]]></text>
    <type>0</type>
  </item>
  <item>
    <text><![CDATA["As you might know, I am a full time Internet"]]></text>
    <type>1</type>
  </item>
</root>

The Text widget can display up to 10 pages of textual content, which can either be plain text or a subset of HTML.
Supported sizes
- 1 x 1
- 1 x 2
- 2 x 1
- 2 x 2
- full-width
Parameters
A maximum of 10 item objects may be provided. Each of them specifies
the text and, optionally, the type of each page.
text
The text attribute accepts any encoding and may optionally be enhanced with a limited set of HTML tags.
type
The optional type parameter can be used to add extra visual clue to each page of the text widget.
When it's not given or set to 0, no icon will be added.
When type is set to 1 (alert) an exclamation point on yellow background will appear in the top right corner. See the Type 1 Example below.
When type is set to 2 (info), an 'i' icon on grey background will be displayed in the top right corner. See the Type 2 Example below.
Type 1 Example
{
  "item": [
    {
      "text": "production-web-1: NOT RESPONDING",
      "type": 1
    }
  ]
}
<?xml version="1.0" encoding="UTF-8"?>
<root>
  <item>
    <text><![CDATA["production-web-1: NOT RESPONDING"]]></text>
    <type>1</type>
  </item>
</root>
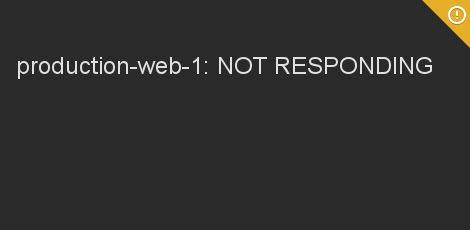
This example shows a text widget where the page currently being
displayed has a type value of 1 (alert).
The yellow exclamation mark in the top-right corner may be used to alert viewers of the dashboard that this particular page of the widget is worth paying attention to.
For example, a text widget displaying the status of your company's
servers may set type to 1 when an outage is currently in progress.
Type 2 Example
{
  "item": [
    {
      "text": "3 to-do items are due next week",
      "type": 2
    }
  ]
}
<?xml version="1.0" encoding="UTF-8"?>
<root>
  <item>
    <text><![CDATA["3 to-do items are due next week"]]></text>
    <type>2</type>
  </item>
</root>
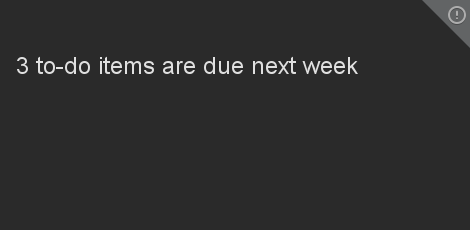
This example shows a text widget where the page currently being
displayed has a type value of 2 (info).
The grey "i" icon in the top-right corner may be used to highlight this page of the widget in particular.
For example, a text widget displaying the state of a shared to-do list
may set type to 2 when certain items are due soon and require
action.
Polling
Polling Overview
Using a custom widget in polling mode requires you to have an endpoint that exposes data in the correct format. Geckoboard then polls that URL and displays the data in the widget.
Configuration
This section goes into a bit more detail about the custom widget configuration screen.
API Key
If you specify an API key it will be sent as the username for HTTP basic auth in the request. The password will be set to “X”.
Request Parameters
Geckoboard appends some parameters (if this is a POST they will go in the body, if this is a GET then they will go on the URL) to allow the information being returned to be customised.
Format
The format, either XML or JSON, that the response from your script should produce.
Values: either ‘1’ (if the widget is configured for XML) or ‘2’ (if the widget is configured for JSON).
Response Formats
<?xml version="1.0" encoding="UTF-8"?>
<root>
  <error>Access denied.</error>
</root>
If authentication is successful, a HTTP status code of 200 OK should be returned.
In all other cases, your server should return a status code of 403, 404 or 500 (whichever is most appropriate), along with a description of the error.
For example, the following XML payload may be returned along with a
status of 403 Forbidden.
Known limitations
There is a 10 second timeout. If we don't receive a response within 10 seconds while polling your endpoints, the widget will timeout with the following message:
Error received when loading widget data:

Errno::ETIMEDOUT
Push
Push Overview
Unlike Polling widgets, whereby data has to be exposed for Geckoboard to poll, the Push API allows data to be pushed directly to widgets instead.
The Push API uses JSON exclusively. XML is not supported.
We’re using WebSockets to update the widgets in real time. You will need a modern browser or Adobe Flash installed to make this work.
Please note that the size of the file that is pushed can not exceed 1 MB.
Details
First of all, you will need a to create a new custom widget to display your data. Go to Geckoboard and create a new custom widget. You should see the following option:
Selecting ‘PUSH’ here will give you a number of different options which you can use to push data to your widget.
Pushing to your widget
To push data to your widget all you need to do is a POST with the correct payload to the URL specified in the widget config.
The payload should be in the following format (this example is for a Number & Secondary Stat widget):
{
  "api_key": "222f66ab58130a8ece8ccd7be57f12e2",
  "data": {
     "item": [
        { "text": "Visitors", "value": 4223 },
        { "text": "", "value": 238 }
      ]
  }
}
You can find your API key on your account page.
The URL you need to POST to is:
https://push.geckoboard.com/v1/send/<widget_key>
This is available in the widget config along with the widget key.
The data must be in the format required by the custom widget you have chosen. See Widget Types for the required format.
Errors
{
  "message": "Informative error message"
}
API errors will result in an HTTP response with a suitable status code and the following JSON response:
Below are some of the possible error conditions, along with their status code:
| Error | HTTP Status Code |
|---|---|
| Response body is empty or invalid JSON | 400 |
| You are not authorized to push to this widget | 401 |
| Widget does not support push | 403 |
| Your API key is invalid | 403 |
| The widget does not exist | 404 |
| The request body is too large | 413 |
| You have exceeded your rate limit | 429 |
Please note that invalid widget data, such as missing required fields, incorrect number formatting, etc. will still result in a 200 OK response from the Push API. Please check the dashboard containing the widget you are pushing to in order to see any validation errors that may have occurred.
Rate Limiting
{
  "error":"Rate limit exceeded"
}
There is basic rate limiting on the API. This restricts you to 12,000 requests in a 60-minute period for your account. Please get in contact if you’d like to discuss increasing this limit.
If you exceed your rate then the API will return a 429 status and the following error message:
cURL Example
curl -X POST https://push.geckoboard.com/v1/send/example-widget-key -d '{"api_key":"example-api-key","data":{"item":[{"text":"This is a new message","type":0}]}}' -H "Content-Type:application/json"
Here’s a quick example of how to push some data via cURL: